Phase 05
Data model, SQL/ETL and automation
Create a governed analytical path from synthetic operational records to reconciled facts, dimensions, SQL analysis and safe automation.
Inspect the evidence
The relationships in the verified Power BI model
The implemented report uses Application Data as its case-level hub. This is the actual model, distinct from the conceptual warehouse layers below.
Open relationship diagram at full size ↗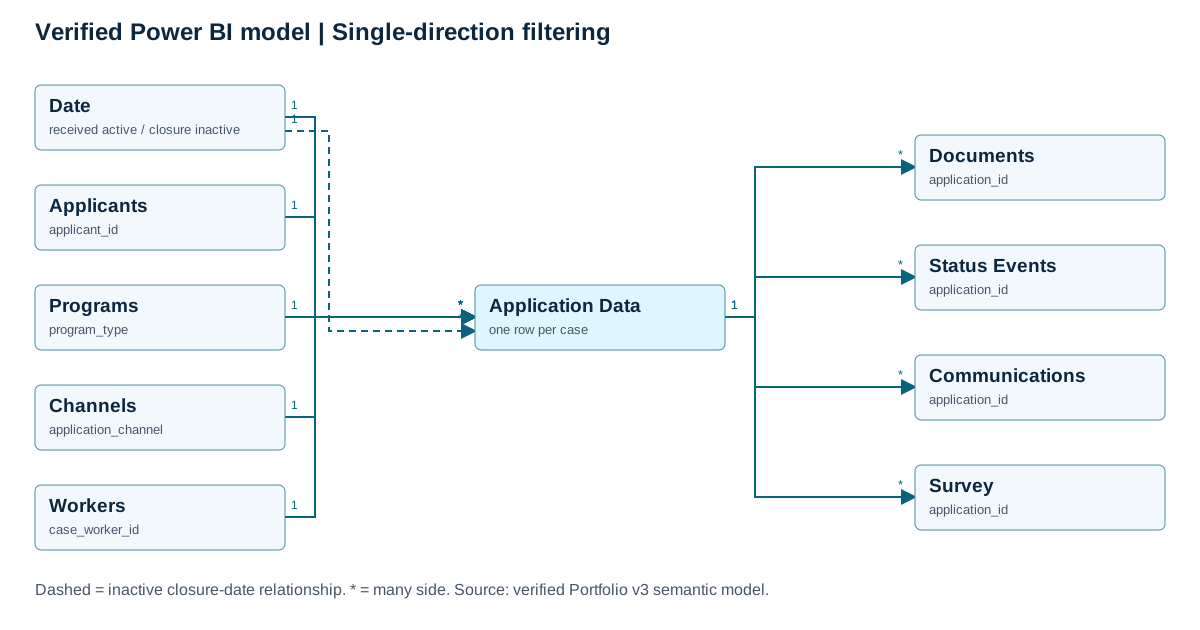
Single-direction filters. Received date is active; closure date is inactive and activated by the relevant measures. Keep application totals at case grain; do not multiply them by joining several child event tables.
SQL example: validate the intake baseline
SELECT COUNT(*) AS applications,
  ROUND(AVG(CAST(complete_at_intake_flag AS REAL)), 4)
    AS first_pass_complete_rate,
  ROUND(AVG(CAST(manual_touch_count AS REAL)), 2)
    AS average_manual_touches
FROM fact_applications;- Applications
- 2,400
- First-pass complete
- 0.5804 → 58.0%
- Manual touches
- 9.61 → 9.6
Re-executed against the project’s read-only SQLite database on 5 September 2026. The result supports investigating intake rework; it does not establish causation or demonstrate achieved improvement.
Conceptual analytical layers
Dim dateDim programDim channel
Fact applicationone row per caseFact status eventFact documentFact communicationFact survey
Dim applicantDim workerKPI definitions
01Raw extracts
02Typed staging
03Conformed keys
04Analytics facts
05Power BI semantic model
Synthetic operational data
| Dataset | Rows |
|---|---|
| Applicants | 2,400 |
| Applications | 2,400 |
| Documents | 10,341 |
| Status events | 15,617 |
| Communications | 8,674 |
| Survey responses | 852 |
SQL analysis
- Baseline controls and reconciliation
- SLA by program
- Channel completeness and cycle
- Failure demand and backlog age
Quality gates
- Unique application and event keys
- No orphaned relationships
- Valid date order and status sequence
- Exact source-to-model row reconciliation
Automation controls
- Idempotent case creation and retries
- Reasoned human override
- Allow-listed public status payload
- Stop publish when validation fails
My analysis and method Why this phase matters
Reliable process decisions require definitions, lineage and quality controls—not only attractive dashboards.
Capability demonstrated
What this work shows
Defined fact grains and conformed applicant, program, channel, worker and date dimensions.
Separated schema, load, transformation, analysis and quality-control scripts.
Designed idempotency, audit events, overrides and failed-load stops.
Fictional municipal scenario, synthetic data, simulated discovery and validation. No City of Toronto affiliation or claimed production outcome.