Phase 06
KPIs, RBA and Power BI decision support
Explore the actual six-page Power BI report, then review the KPI definitions, RBA questions and limits behind its findings.
The actual Power BI report
Explore the six report pages
Exported directly from the verified final report. Read the evidence, its purpose and the proposed response.
Static report preview. Use the tabs below to change pages. Filters, charts and buttons inside the exported images are not interactive. The full interactive report remains in Power BI Desktop.
Executive overview
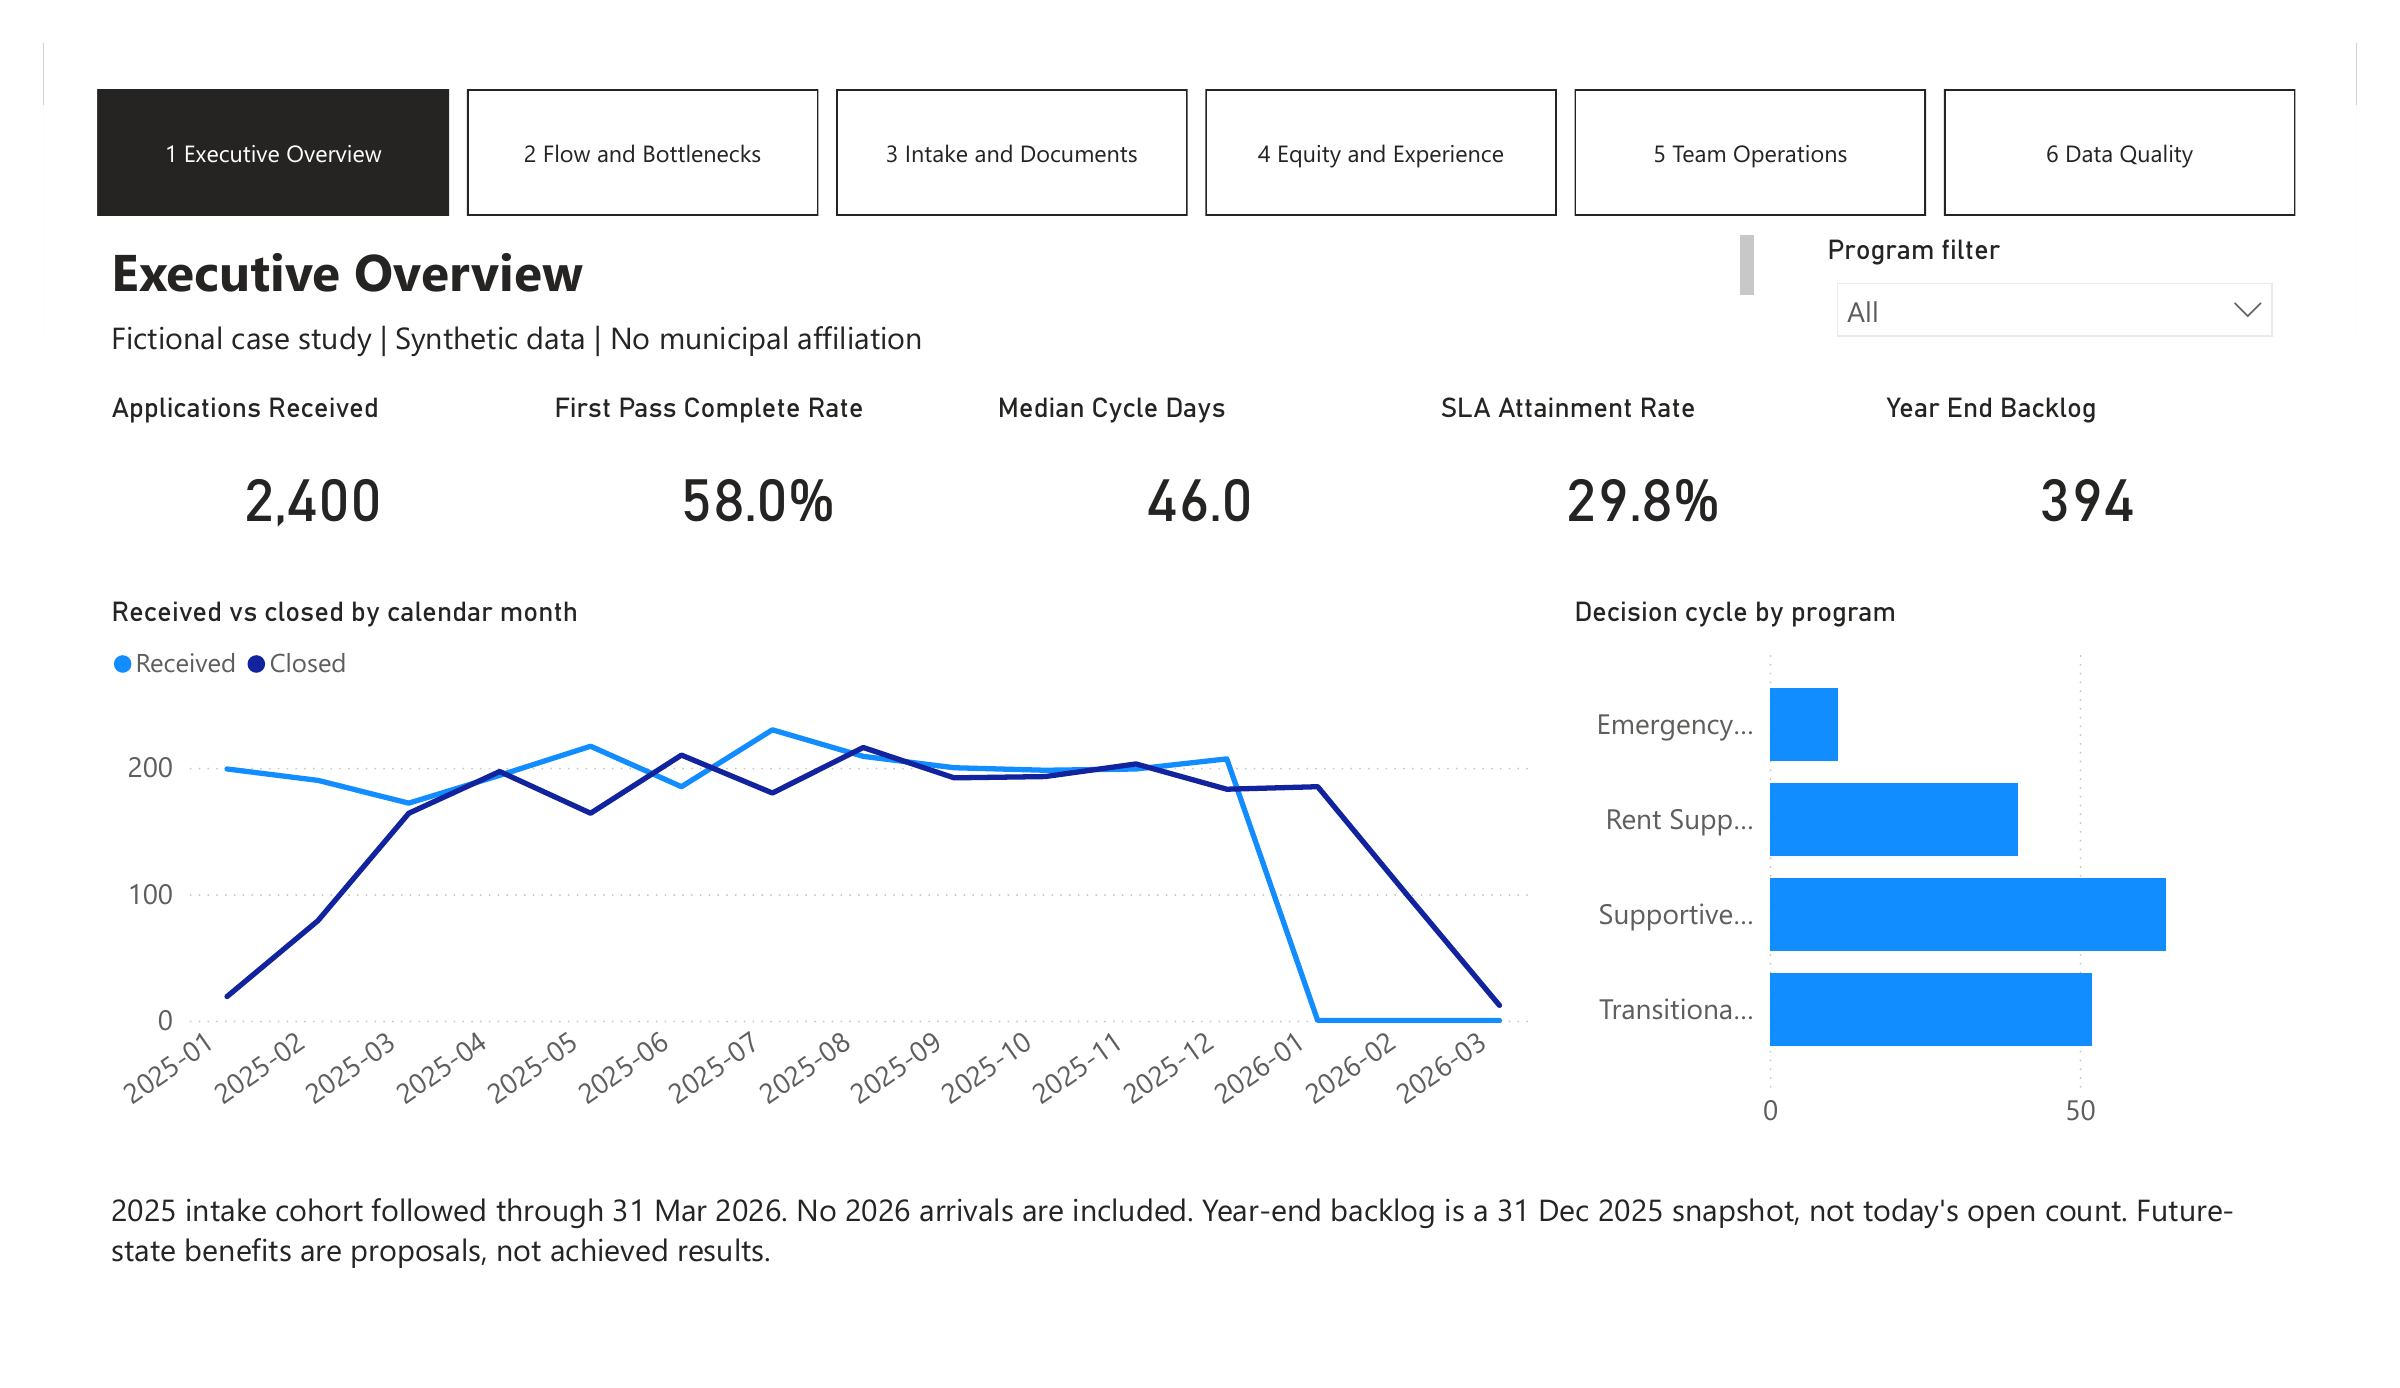
Headline values in readable text
- 2,400 applications
- 58.0% first-pass complete
- 46-day median cycle
- 29.8% SLA attainment
- 394 year-end backlog
Unfiltered synthetic snapshot. These headline values are a reading aid, not a complete transcription of every chart. Full metric names, periods and cautions are explained below.
Business question
Where should leaders focus the service-improvement pilot?
2,400 applications · 58.0% first-pass complete · 46-day median cycle · 29.8% SLA attainment · 394 year-end backlog
What the evidence shows
Intake quality and decision delays provide a measurable reason to investigate rework. The monthly chart compares receipts and closures; the program chart shows different decision-cycle profiles.
How the proposal responds
Pilot guided intake and clearer handoffs, then compare service quality and cycle time with the baseline.
Read with careThe cohort contains 2025 arrivals followed through 31 March 2026. The backlog is a 31 December 2025 snapshot, not today’s open count. Program differences alone do not establish their causes.
Inspect the evidence
How much did we do?
- Applications received
- Cases closed
- Documents and communications processed
How well did we do it?
- Completeness and SLA attainment
- Cycle distribution and backlog
- Data quality and accessibility
Is anyone better off?
- Fewer avoidable contacts
- Improved service experience
- No worse assisted-channel or equity outcomes
KPI dictionary
| ID | Measure | Synthetic baseline | Strategic hypothesis |
|---|---|---|---|
| KPI-01 | Applications received | 2,400 | Monitor |
| KPI-02 | First-pass completeness | 58.0% | 80% |
| KPI-03 | Median decision cycle | 46 days | 25 days |
| KPI-04 | P90 decision cycle | 69 days | 55 days |
| KPI-05 | SLA attainment | 29.8% | 85% |
| KPI-06 | Year-end backlog | 394 | Reduce >30-day by 40% |
| KPI-07 | Average manual touches | 9.6 | 7.0 |
| KPI-08 | Status inquiries / application | 1.24 | 0.45 |
| KPI-09 | Reopen rate | 9.2% | 5% |
| KPI-10 | Positive service experience | 34.5% | 80% |
The strategic targets are hypotheses. Separate, lower pilot continuation gates support learning and do not represent achieved outcomes.
My analysis and method Why this phase matters
Measurement prevents teams from optimizing one headline number while hiding backlog, equity, quality or failure demand.
Capability demonstrated
What this work shows
Defined numerator, denominator, grain, owner, frequency and limitations.
Balanced volume, quality and outcome-oriented questions.
Built a six-page native report with semantic measures, filters and quality controls; the original exports are shown above.
Fictional municipal scenario, synthetic data, simulated discovery and validation. No City of Toronto affiliation or claimed production outcome.